Fig. 3.
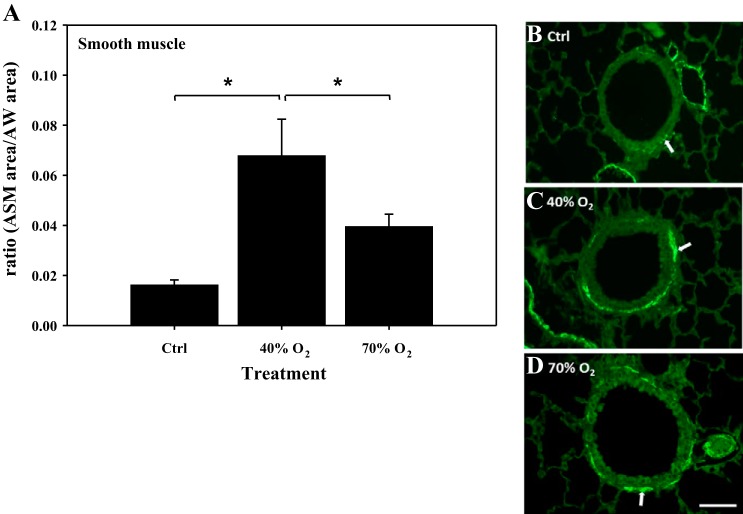
Immunohistochemical quantification of airway smooth muscle (ASM)/airway surface area (AW) in mice exposed to neonatal hyperoxia. Note: amount of smooth muscle area expressed as a ratio to the total airway surface area (ASM/AW area) was increased in 40% oxygen-, but not in 70% oxygen-exposed mice compared with control (A). Representative sections illustrate immunostained ASM from each treatment group (B–D). ASM is identified by the green color highlighted by white arrows (Bar = 50 μm). *Significant difference, P < 0.05.

