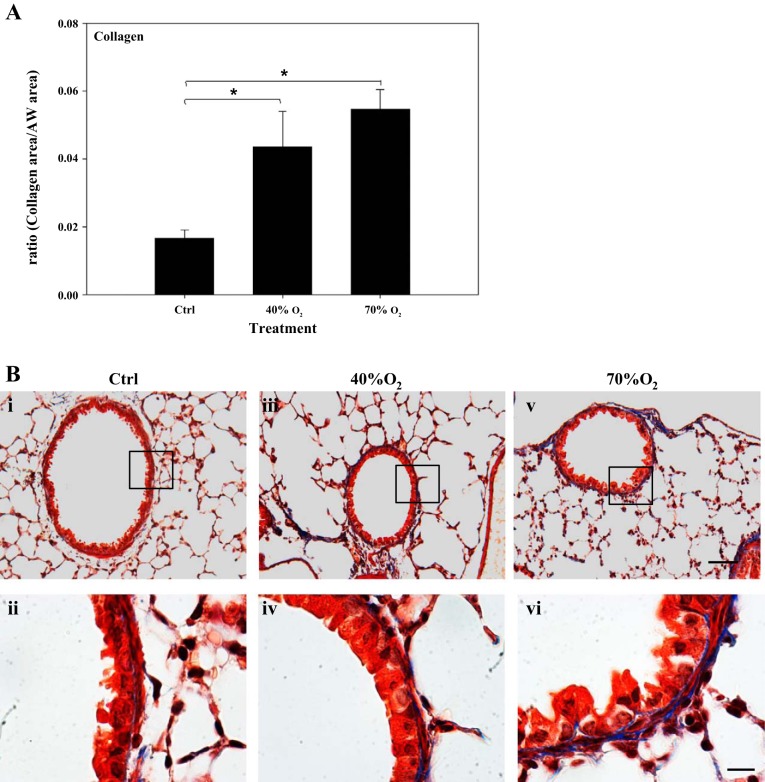
Fig. 4.
Quantification of airway (AW) collagen in mice exposed to neonatal hyperoxia. Note: collagen was increased (A) in the lungs of 40% oxygen- (iii and iv) and 70% oxygen-exposed mice (v and vi) compared with control (i and ii) mice. Representative sections illustrate collagen staining in lungs from each treatment group (B). Sections are trichrome stained for collagen (blue) and noncollagen tissue (red). Bar = 20 μm in top panels and 100 μm in bottom panels; *significant difference, P < 0.05.

