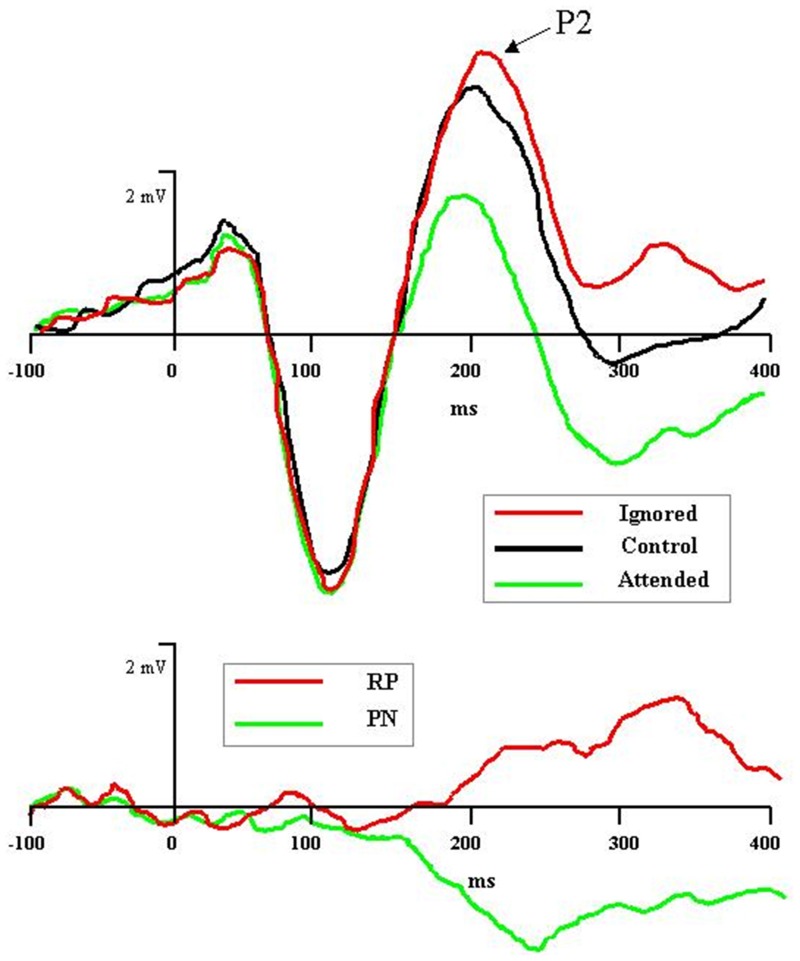
Figure 1.
Graphic depiction of rejection positivity (RP) to distractors and processing negativity (PN) to targets in an auditory selective attention task (after Bidet-Caulet et al., 2010). Top panel: Grand averaged ERPs to attended (in green), control (i.e., non-attention, in black), and ignored (in red) stimuli reveal attention-induced separation of waveforms beginning with the P2 component, 200 ms after stimulus onset. Bottom panel: Difference of ignored vs. control waves (in red), depicting RP, and attended vs. control waves (in green), depicting PN.

