Figure 4.

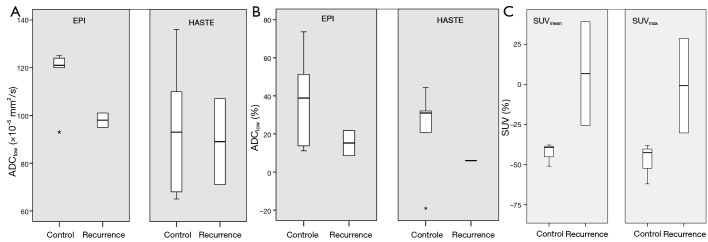
Comparison of lymph node (A) ADClow at DW-MRI2, (B) ΔADClow-2weeks (in %) and (C) ΔSUV2weeks (in %), in six patients with regional control and two patients with recurrent disease. Box-whisker plots are presented with median (–), interquartile range (box), and range (–).
