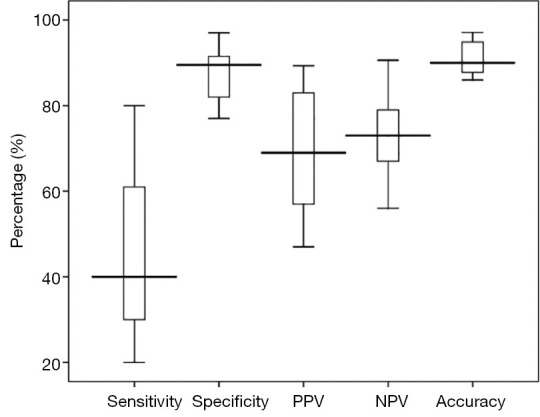
Figure 3.

The box plot shows the mean diagnostic accuracy for cerebral CTP in acute stroke detection. The boxes indicate the first to third quartiles; each midline indicates the median (second quartile) and the whiskers represent the maximum and minimum percentage of respective parameters. CTP, CT perfusion; PPV, positive predictive value; NPV, negative predictive value.
