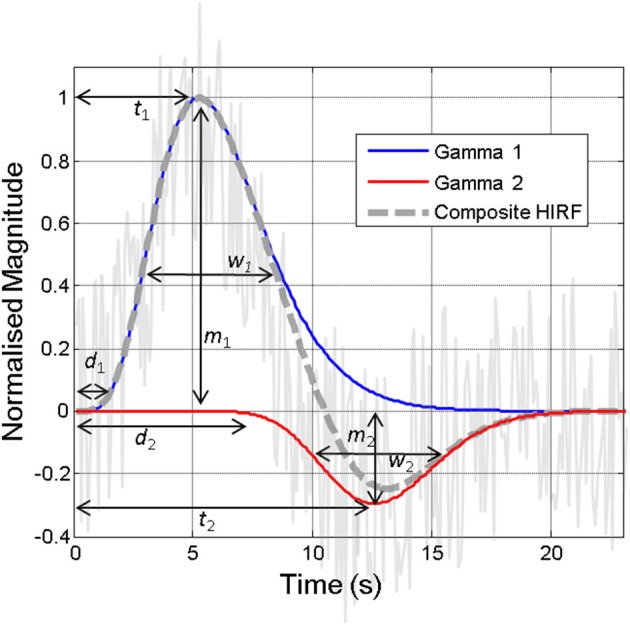
Figure 2.

Illustration of the hemodynamic impulse response function (HIRF, dashed gray line), which typically comprises two gamma functions (red and blue lines), together approximating the hemodynamic responses present in often noisy acquired neuroimaging data (solid gray line). The various parameters required to specify the HIRF are illustrated. Variations in these parameters that are not accounted for can lead to inaccurate detection of “activity” in neuroimaging studies. Some of the factors that might alter these parameters are illustrated in Figure 6.
