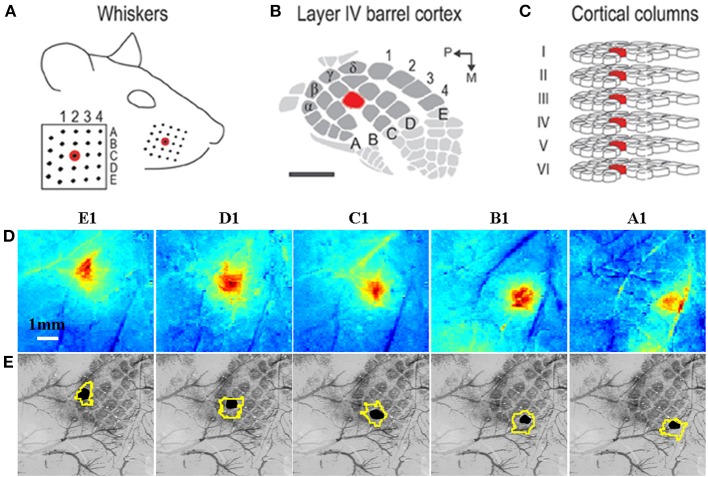
Figure 3.
Grid-like arrangement of the rodent facial whiskers (A) is topographically preserved with mapping in somatosensory cortex (B) of individual whiskers to individual cortical columns (C). (A–C) adapted from Chen-Bee et al. (2012). (D) Measurement of total hemoglobin concentration changes during stimulation of individual whiskers (A1–E1) produces spatiotemporal activation maps that allow spatial discrimination of activation primarily located in each corresponding cortical column. (E) Co-registered surface (vasculature) and cortical histological sections with the stimulated barrel highlighted in black to verify anatomical specificity. The contour around each stimulated barrel is the activated total hemoglobin region defined as all pixels with 50% of the peak response from a mean image of the last 4 s of the 16 s stimulation period. (D,E) adapted with permission from Berwick et al. (2008).

