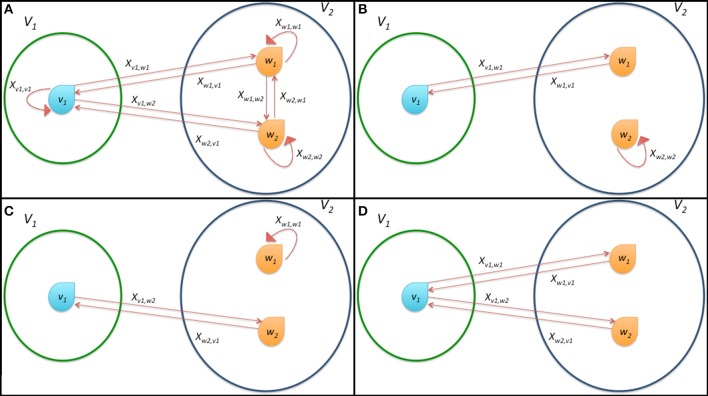
Figure 3.
Schematic representation of the connections among the bacteria in a simple system composed by only three microorganisms divided in the two classes
 1 and
1 and
 2. (A) shows all possible connections, (B,C) report the effective formation of a single connection and (D) represents the onset of multiple connections. The state variables xv, w describing the dynamics of the system according to Equation (7) are also reported as labels of arcs of the graph.

