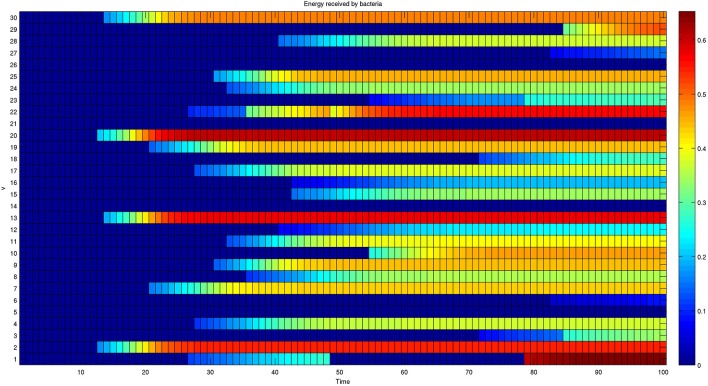
Figure 6.
Dynamics of the energy received by each member of a network composed of 30 bacteria. The colors reported in each row represent the energy received by a single bacterium over time. The energy received initially is null for all bacteria. The presence of oscillating behaviors, such as the one shown by bacterium 1, shows that the final configuration is also the result of transient activated/deactivated connections.

