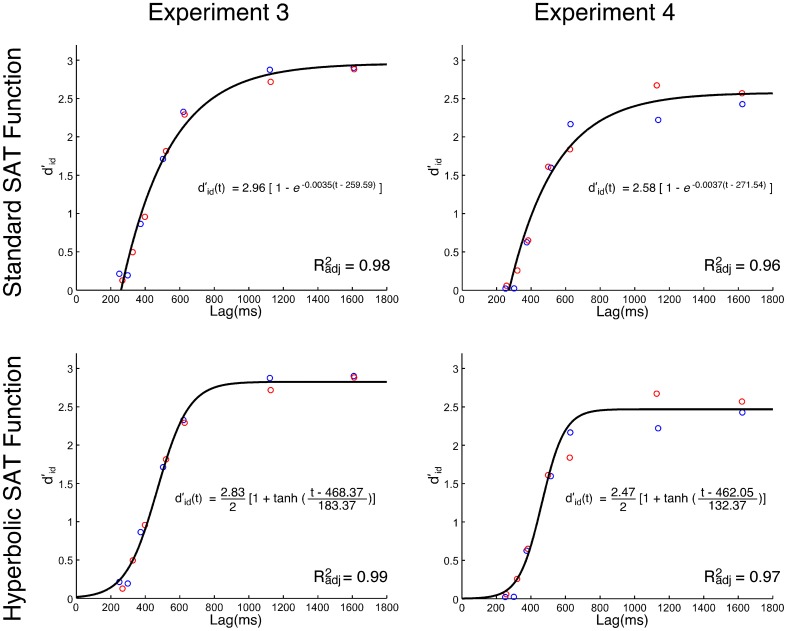
Figure 2.
Group mean d'id values as a function of processing lag (ms) in Experiments 3 and 4. Top-row: best fit of the standard speed-accuracy tradeoff function (Equation 3). Bottom-row: best fit of the hyperbolic tangent speed-accuracy tradeoff function (Equation 4). The Simon SAT data from the spatial incompatibility group are red. The Simon SAT data from the spatial compatibility group are blue.

