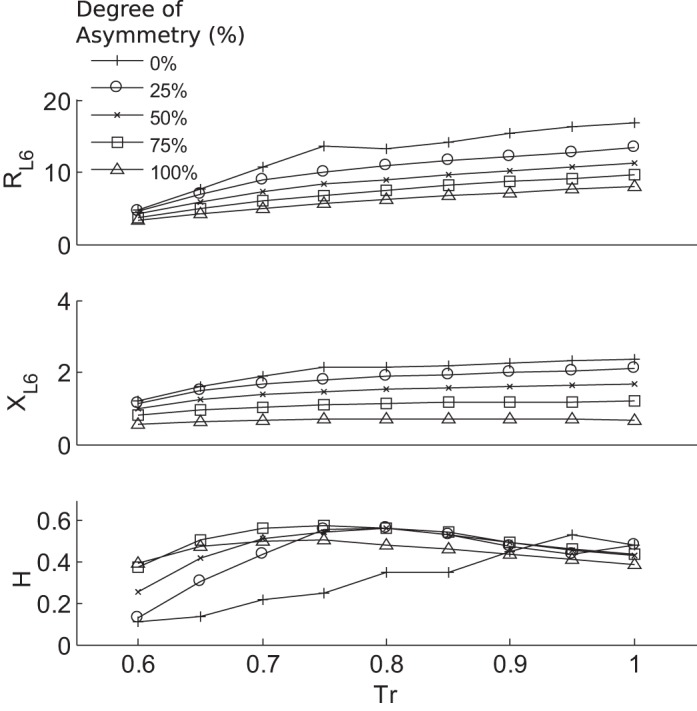
Fig. 4.

The RL6, XL6, and Shannon entropy of flow (H) for all airway trees at the end of the simulation (steady state) for different levels of airway smooth muscle activation Tr. Increasing Tr generally led to an increase in both the resistance and reactance at 6 Hz, which was more pronounced with decreasing asymmetry. Correspondingly, increasing asymmetry lowered resistance and reactance values for a given Tr value. H was normalized by the maximum possible entropy with all states occupied. H was found to reach maximum values that were for each degree of asymmetry at different Tr and corresponded to the emergence of ventilation defects.
