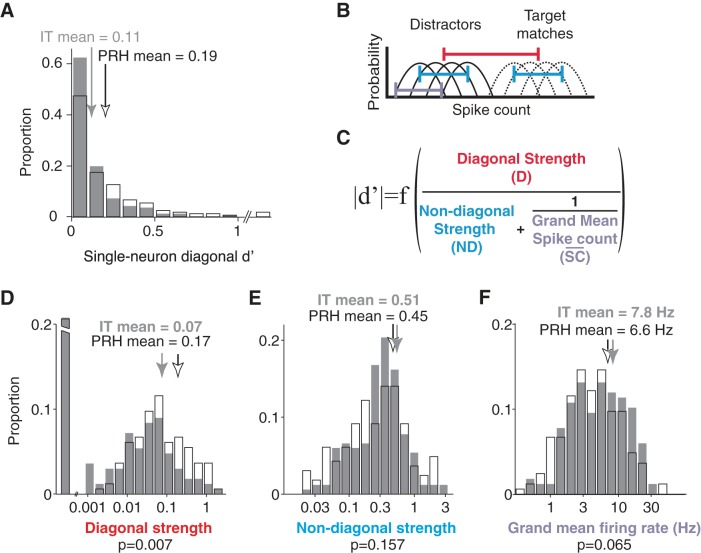
Fig. 5.
Relating signal modulation magnitudes with task performance (d′). A: diagonal d′, computed as the absolute value of d′, followed by bias correction (Eq. 13). Histograms are shown for 167 neurons recorded in IT and 164 neurons recorded in PRH. PRH neurons with neuron diagonal d′ of 1.1, 1.3, and 2.1 are included in the last bin. Arrows indicate means. B: the diagonal d′ calculation was based on the distributions of responses over trials to the target matches (dashed lines) and to the distractors (solid lines). C: diagonal d′ can be expressed as a function of 3 intuitive components. B and C: diagonal strength (red) is computed as a function of the normalized diagonal weight (Eq. 15), and this component determines the distance between the average response to all target matches and the average response to all distractors (red line); diagonal d′ is proportional to this component (see text). The nondiagonal strength (cyan) is computed as a function of the combined normalized nondiagonal weights (Eq. 16), and this component determines the spread within the target matches and within the distractors (cyan line); diagonal d′ is inversely related to this component (see text). The final component (lavender) captures the trial-by-trial variability of the neuron (lavender line). Within a Poisson process and after normalization, this term can be estimated by the inverse of the grand mean spike count across all conditions (Eq. 40), and thus diagonal d′ increases monotonically with the grand mean spike count (see text). D–F: diagonal strength (D), nondiagonal strength (E), and grand mean firing rate (F), in IT (gray) and PRH (white). Arrows indicate means. In D, the 1st bin includes neurons with a diagonal strength <0.001 and the broken axis extends to a proportion of 0.46 in IT and 0.34 in PRH.

