Fig. 4.
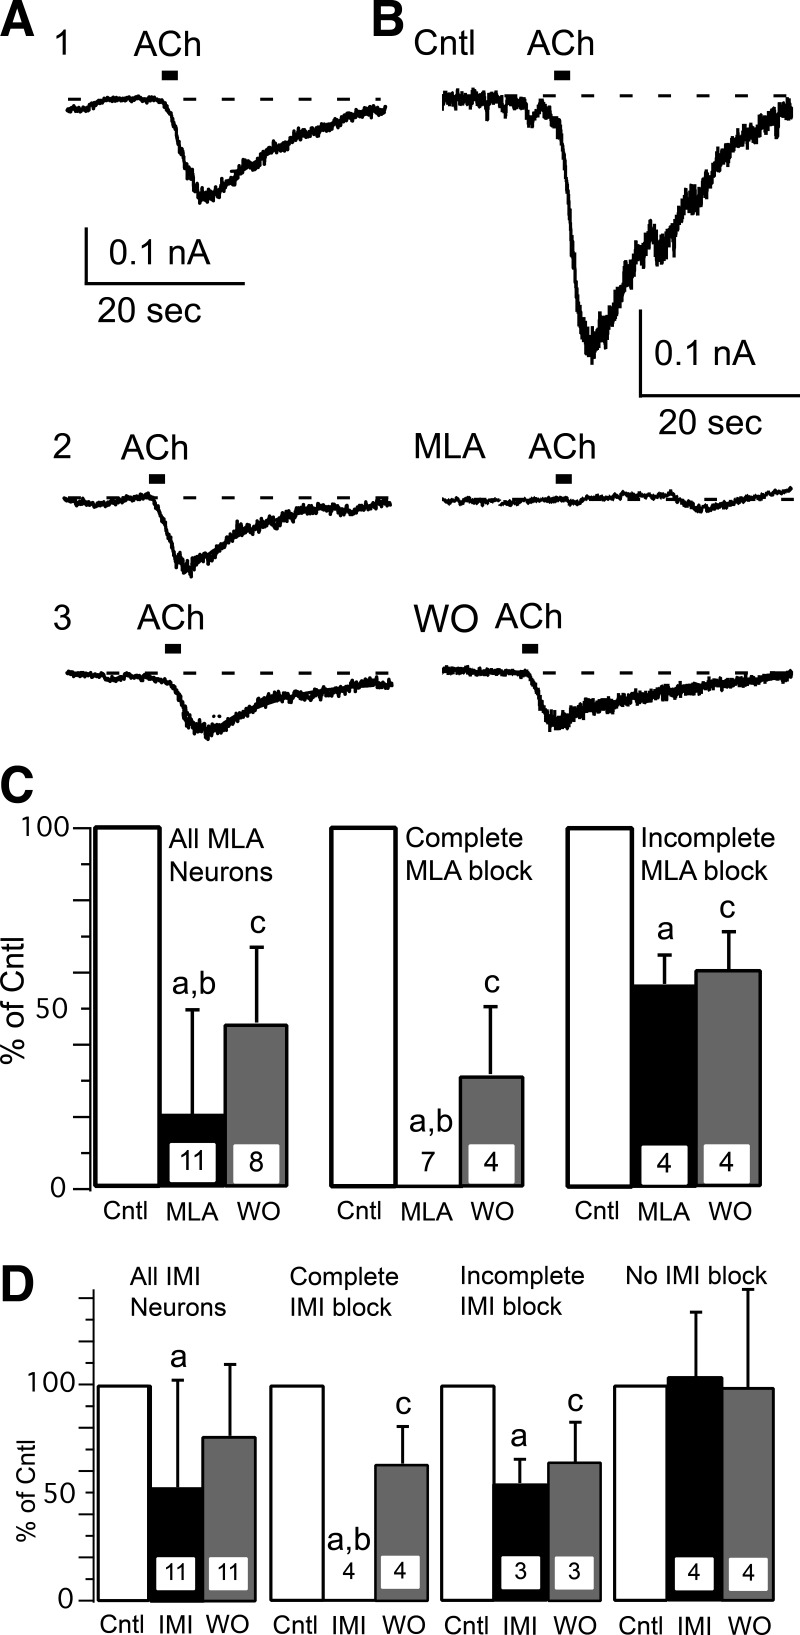
ACh responses can be blocked by specific α7-nAChR antagonists. A: multiple ACh responses can be measured with limited desensitization, which was minimized by applying ACh (1 mM) for 2 s once every 3 min. An example is shown from 1 control neuron for 3 (1–3) ACh responses recorded at 3-min intervals. B: the specific α7-nAChR antagonist methyllycaconitine (MLA; 10 nM, 3-min application) completely blocked ACh-induced current in this muscle afferent neuron. A partial recovery was recorded after 3 min of MLA washout (WO). C: these bar graphs show percentage block and WO for 10 nM MLA. The left set of bar graphs show mean (+ SD) for all neurons tested with MLA, whereas the middle graph shows the 7 neurons in which MLA completely blocked the ACh response, and the right graph shows the remaining 4 neurons in which the block was partial. Note that 3 neurons were lost before recovery from MLA block could be recorded. D: bar graphs show the percentage block of ACh responses and WO for 100 μM α-conotoxin ImI (IMI). The left set of bar graphs show mean block (+ SD) for all neurons tested with IMI, whereas the middle graphs show the 4 neurons in which IMI completely blocked (middle left) and 3 neurons in which IMI partially blocked (middle right) the ACh response. The right graph shows the remaining 4 neurons in which IMI did not affect the ACh response. The ACh concentration was 1 mM. The lowercase letters above the bars indicate significant differences with “a” indicating significant difference between test (MLA or IMI) and control (Cntl), “b” indicating significant difference between test and WO, and “c” indicating significant difference between WO and Cntl.

