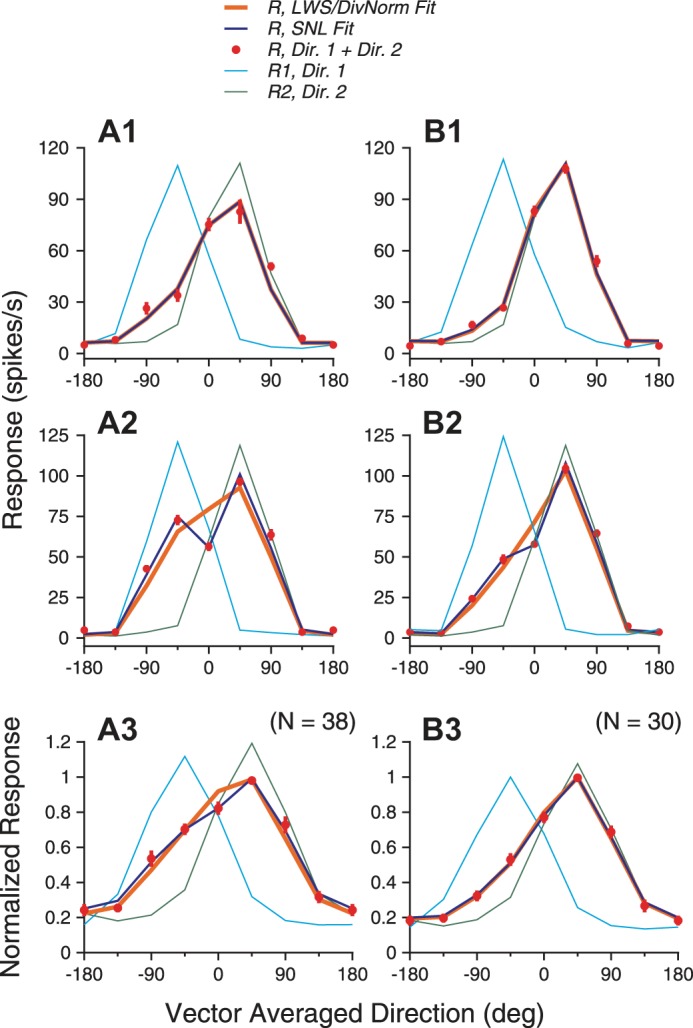
Fig. 12.

Model fits of response tuning curves elicited by bidirectional stimuli moving at different luminance levels. A1–A3 (left) and B1–B3 (right) show results when the luminance levels of the 2 stimulus components were 10 vs. 40 cd/m2 and 2.5 vs. 40 cd/m2, respectively. The DivNorm model fits gave the same results as the LWS fits. A1 and B1: example neuron 1. The 3 models, LWS, DivNorm, and SNL, provided almost identical fits. A2 and B2: example neuron 2. The SNL model provided better fits than the LWS or DivNorm models. Including response nonlinearity increased the variance accounted for from 91.0% (LWS/DivNorm) to 98.8% (SNL) when the lower luminance was 10 cd/m2 and increased the variance from 96.8% (LWS/DivNorm) to 99.5% (SNL) when the lower luminance was 2.5 cd/m2. A3 and B3: model fits of the population-averaged tuning curves. Error bars of the bidirectional responses indicate SE.
