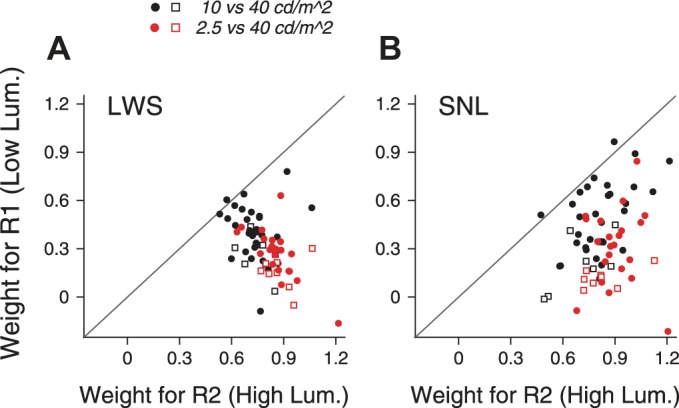
Fig. 13.

Response weights for the 2 motion components that had different luminance levels. A: response weights obtained using the LWS fits. B: response weights obtained using the SNL fits. When the lower luminance was 10 cd/m2, the median response weights for the higher- and lower-luminance components obtained using the SNL fits were 0.79 and 0.43, respectively. When the lower luminance was 2.5 cd/m2, the median response weights for the higher- and lower-luminance components were 0.87 and 0.23, respectively. Filled circles show results from monkey BJ; open squares show results from monkey RG.
