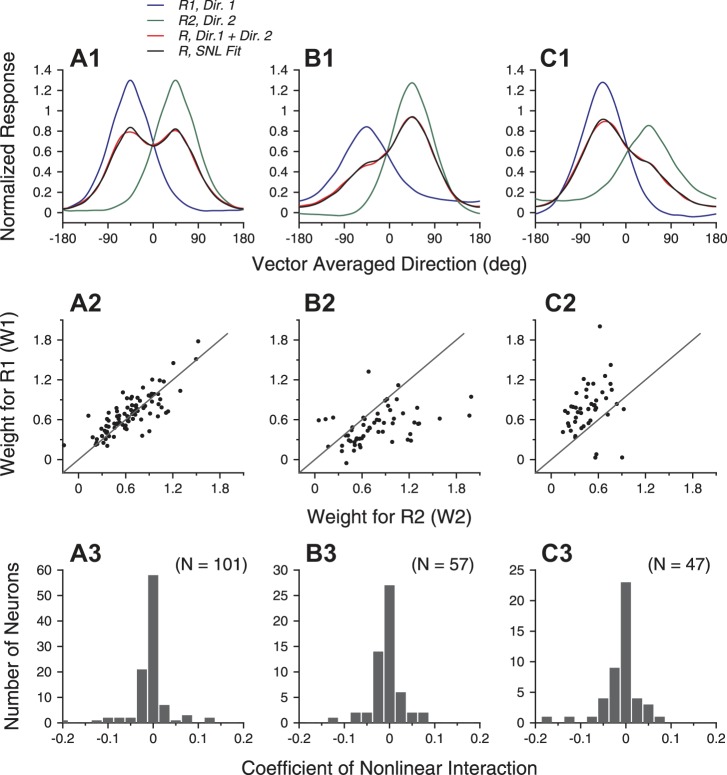
Fig. 7.
SNL model fits of the population-averaged tuning curves and the response weights for the stimulus components. A: both motion components moved at 100% coherence. B: the clockwise-side component moved at 100% coherence, and the other motion component moved at 60% coherence. C: the CC-side component moved at 100% coherence, and the other motion component moved at 60% coherence. A1–C1: SNL fits of the population-averaged tuning curves elicited by the bidirectional stimuli. A2–C2: response weights for the 2 stimulus components obtained using the SNL fits. A3–C3: distribution of the nonlinear interaction coefficient of the SNL fits.

