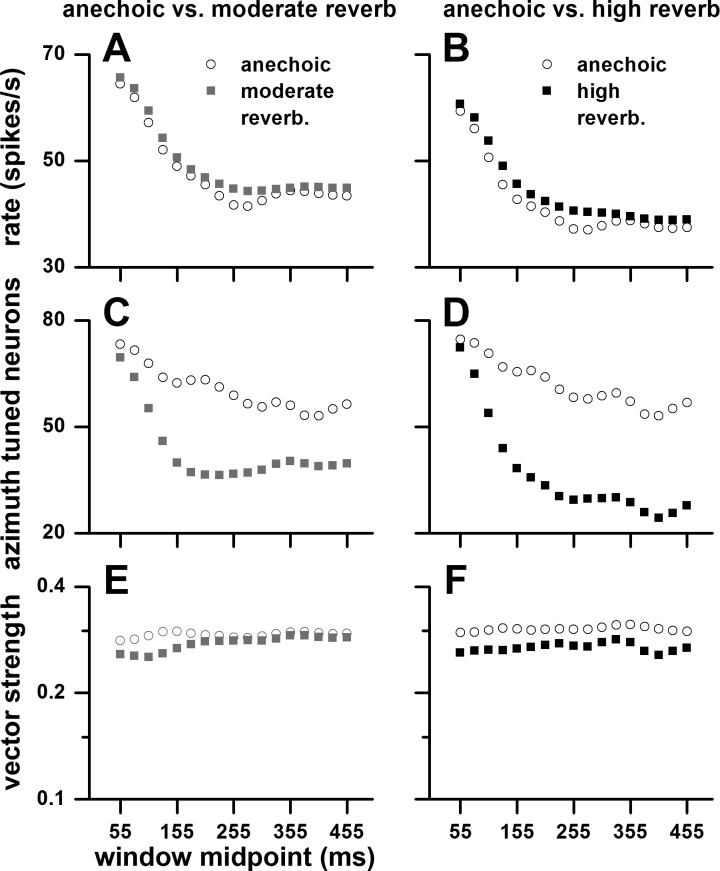
Fig. 10.
Time course of firing rate (A and B), % significant (P < 0.05) azimuth-tuned neurons (C and D), and mean significant vector strength of azimuth tuning (E and F). The neural responses were measured in 100-ms-long, 75%-overlapping windows spanning from 5 to 505 ms (re: stimulus onset, e.g., 5–105, 30–130, 55–155 ms, etc.). Left: comparisons between anechoic and moderately reverberant matched neurons. Right: comparisons between anechoic and highly reverberant matched neurons. Sample size: anechoic-moderate reverberation, n = 81; anechoic-high reverberation, n = 50. Sound source distance = 80 cm.

