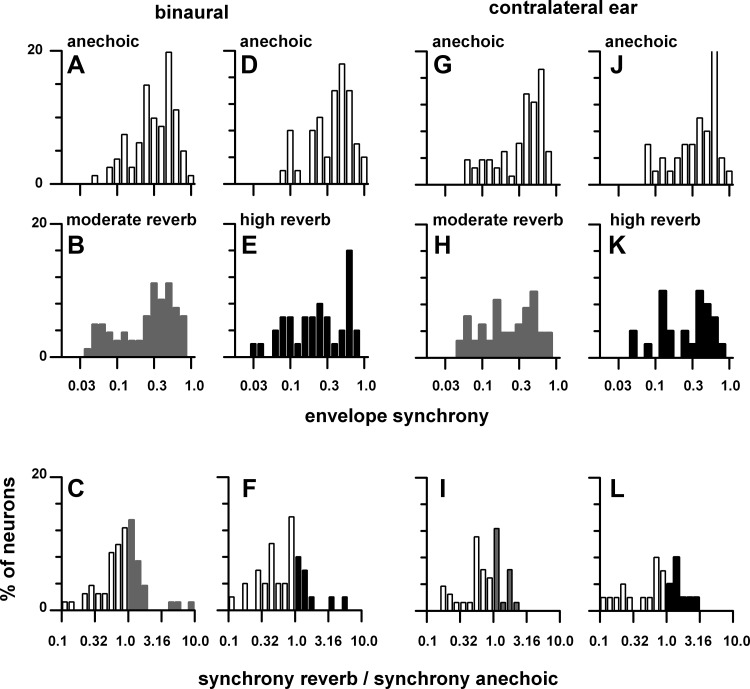
Fig. 14.
Distribution of weighted synchrony in the contralateral sound field for matched neurons in the anechoic (open bars), moderately reverberant (gray bars), and highly reverberant (black bars) environments. A–F: binaural stimulation. G–L: contralateral ear stimulation. Top: distribution in the anechoic condition. Middle: distribution in the moderately reverberant and highly reverberant environments. Bottom: mean ratio of synchrony in the reverberant condition to that in the anechoic environment. y-Axis is % of neurons. The sample size is stated in Fig. 13. Sound source distance = 80 cm.

