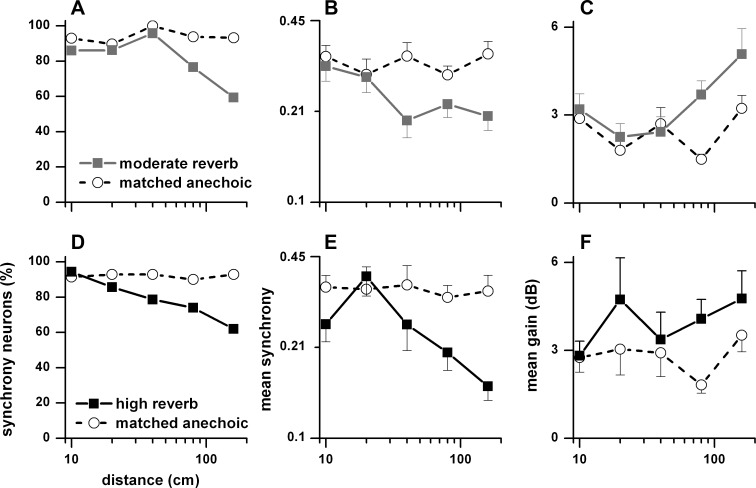
Fig. 18.
Percentage of neurons (A and D), weighted mean synchrony (B and E), and weighted mean gain (C and F) in the contralateral sound field to binaural stimulation as a function of distance (10–160 cm). A–C: matched neurons in the anechoic and moderately reverberant conditions. D–F: matched neurons in the anechoic and highly reverberant conditions. Error bars are SE. Sample size for the anechoic and moderately reverberant matched neurons: 10 cm (n = 43), 20 cm (n = 29), 40 cm (n = 24), 80 cm (n = 81), and 160 cm (n = 59). Sample size for the anechoic and highly reverberant matched neurons: 10 cm (n = 35), 20 cm (n = 14), 40 cm (n = 14), 80 cm (n = 50), and 160 cm (n = 42).

