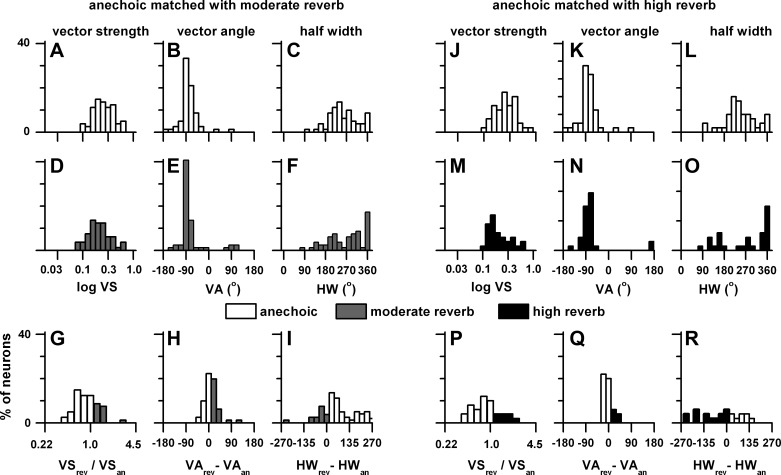
Fig. 4.
Distributions of vector strength (VS), vector angle (VA), and half-width (HW) for neurons measured at a sound source distance of 80 cm that showed significant azimuth tuning (vector strength, P < 0.001). A–F: distributions of the 3 measures in the matched neurons in the anechoic and moderately reverberant conditions. J–O: distributions of the 3 measures in the matched neurons in the anechoic and highly reverberant conditions. G–I: comparisons of the 3 measures between the anechoic and moderately reverberant conditions. P–R: comparisons of the 3 measures between the anechoic and highly reverberant conditions. The sample size is stated in Fig. 3.

