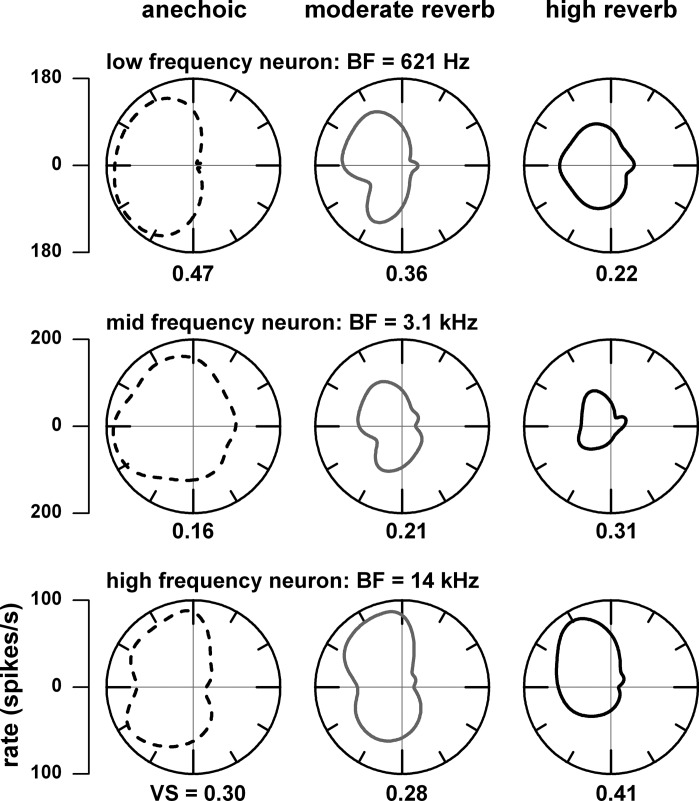
Fig. 8.
Examples of azimuth tuning in neurons with low (top), middle (middle), and high (bottom) best frequencies (BFs) measured in the anechoic (dashed lines, left) and moderately reverberant (gray lines, center), and highly reverberant (black lines, right) environments. Numerical labels represent vector strength (VS).

