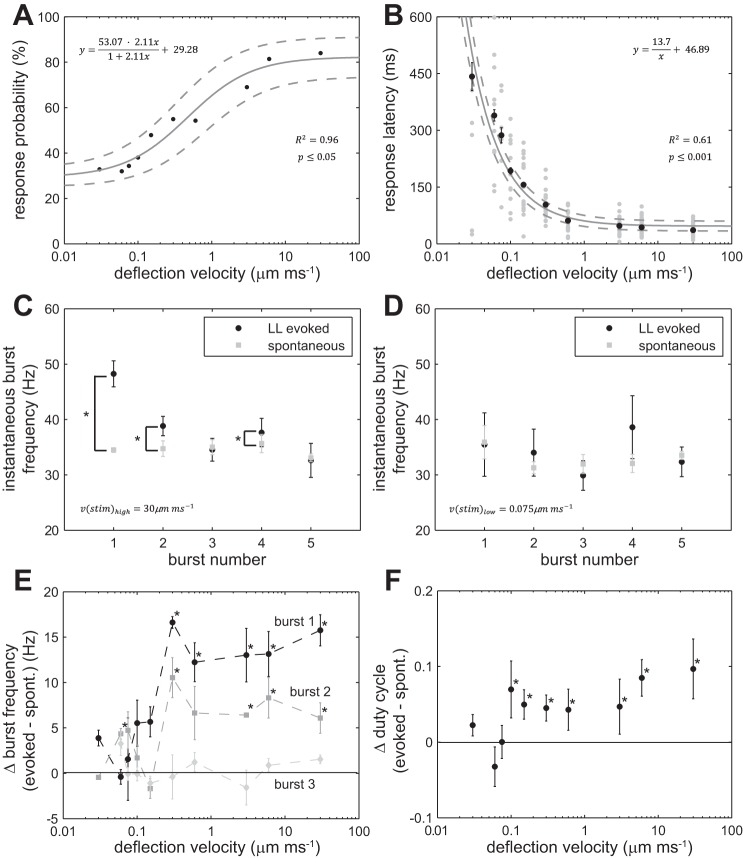
Fig. 5.
Swimming parameters in response to mechanical deflection of the cupula in individual PLL neuromasts. A: swimming response probability increased with deflection velocity (black circles represent probabilities pooled for all neuromasts). Solid line represents fitted model with 95% confidence interval (dashed lines), 67 ≤ n ≤ 72 trials per velocity, where each larva was tested once. B: swimming response latency decreased with deflection velocity (black circles represent mean latencies for positive responses ± SE, gray circles represent individual latencies). Solid line represents fitted model with 95% confidence intervals (dashed lines), 9 ≤ n ≤ 49 swimming responses per velocity. C: a comparison of instantaneous burst frequency for the first five bursts during the initial swim bout of LL evoked swimming and SP swimming. A high velocity deflection (30 μm/ms) evoked a higher swimming frequency for the first two bursts compared with SP swimming (mean burst frequency ± SE; *P ≤ 0.05, paired T-test, n = 49). D: the same comparison using a low velocity deflection (0.075 μm/ms) showed no difference in frequency for all five swimming bursts (n = 17). E: differences in LL evoked and SP swimming were evident for the first and second burst, for deflection velocities ≥0.3 μm/ms (mean instantaneous evoked burst frequency − mean instantaneous SP burst frequency ± SE, 9 ≤ n ≤ 49 per velocity, *P ≤ 0.05, T-test comparing evoked and SP instantaneous burst frequencies). F: the differences in duty cycle between SP and evoked swimming are plotted across deflection velocities. Duty cycle for LL evoked swimming at higher stimulation velocities (>0.1 μm/ms) was higher than for SP swimming (evoked mean duty cycle − SP mean duty cycle ± SE, 9 ≤ n ≤ 49 per velocity, *P ≤ 0.05, T-test comparing evoked and SP duty cycles). In E and F line: y = 0, represents no difference.

