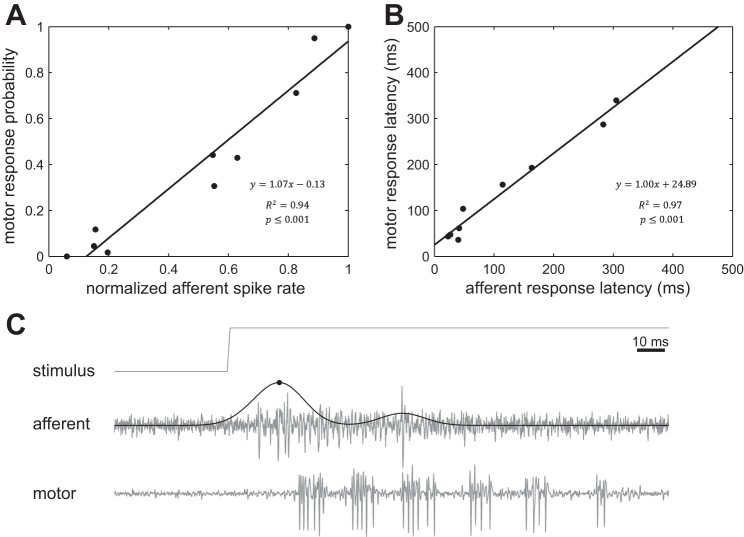
Fig. 6.
A linear relationship exists between afferent neuron activity and swimming in response to deflections of the cupula in single neuromasts. A: probability of swimming response increased linearly with afferent spike rate and began to appear at 15% of the normalized maximum spike rate (black circles represent mean values). B: motor response latencies were slower as afferent responses to deflections became slower (black circles represent mean values). C: simultaneous recording of an afferent neuron and peripheral motoneurons while deflecting the cupula of connected neuromast. An example is shown to illustrate the delay between the maximum afferent response and motoneuron activity (solid line represents convoluted spike rate, black circle indicates maximum spike rate).

