Figure 2.
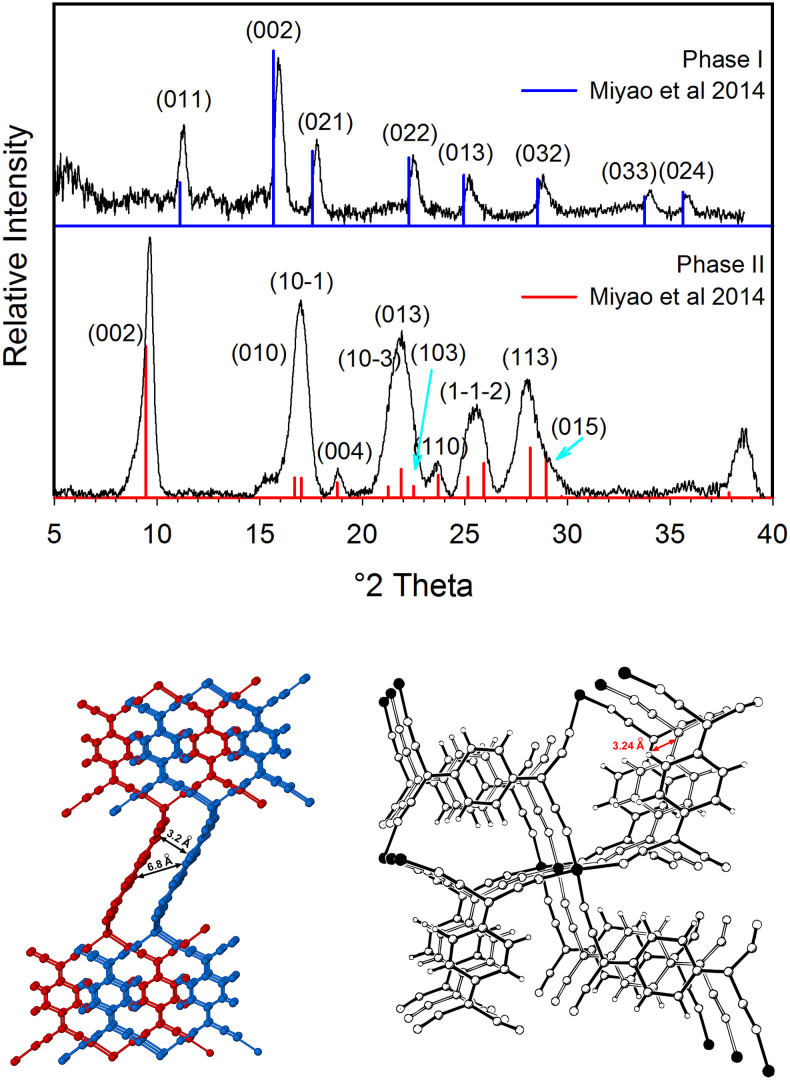
Top: Powder XRD spectra of TCNQCu active and in-active forms showing peak assignments. Bottom: Interpenetrating networks in phase II (left) and phase I (right). Solid bonds are used for one network and the open bonds for the second network. Interplanar distances shown in both phases. Figure on the right was adapted with permission from Heintz, R. A. et al. Inorg Chem 38, 144–156, (1999). Copyright (1999) American Chemical Society.

