Figure 2.

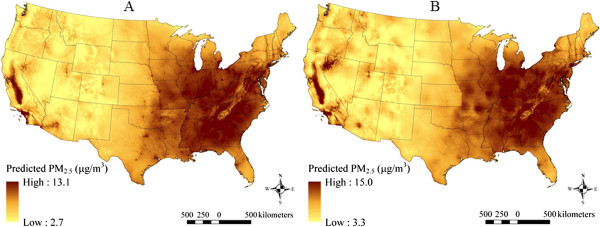
Means of monthly predicted PM 2.5 concentrations on a 6 km grid over the conterminous U.S. (5 th to 95 th percentiles shown) for A) 1999–2007 and B) 1988–1998.

Means of monthly predicted PM 2.5 concentrations on a 6 km grid over the conterminous U.S. (5 th to 95 th percentiles shown) for A) 1999–2007 and B) 1988–1998.