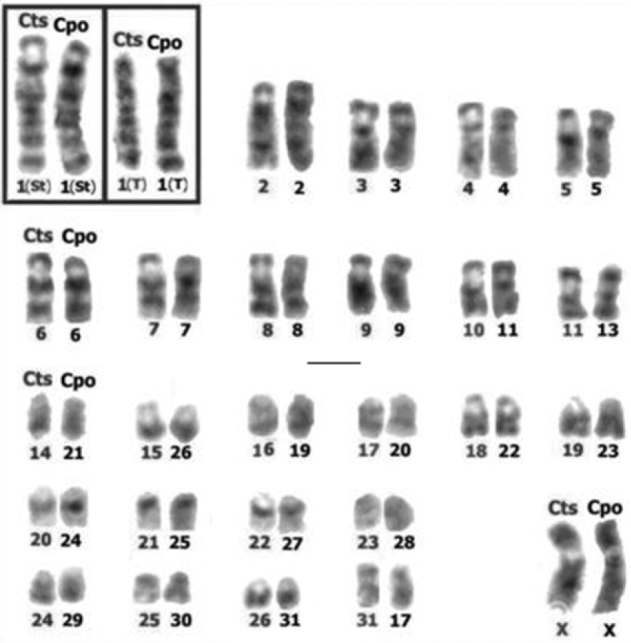
Figure 3.

Chromosomes of Cavia tschudii (Cts) and Cavia porcellus (Cpo) with total G band correspondence. Cts chromosomes are at the left and Cpo at the right of each chromosomal group. Note that the long arms of subtelocentric (St) and telocentric (T) forms of pair 1 show total G band correspondence (inset). Chromosomes numbered according to original karyotype descriptions (see Fig. 1). Bar = 5 µm.
