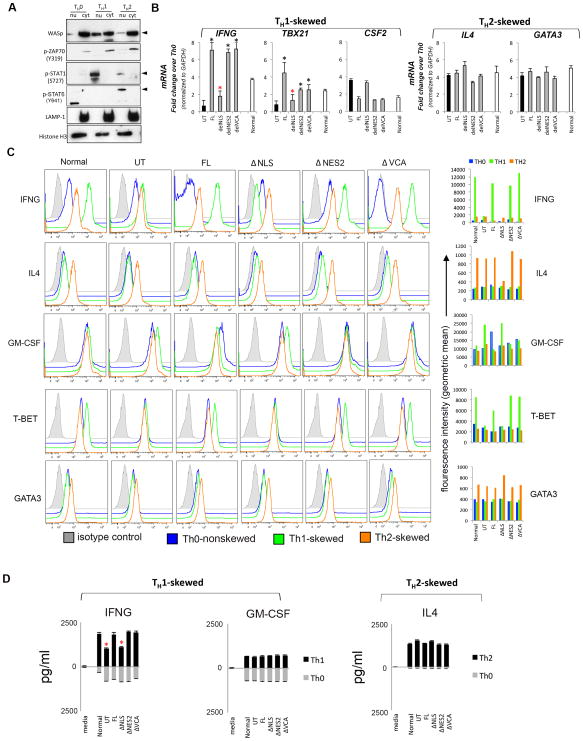
Figure 4. Characterizing the effect of WASp domain-deleted mutants on TH1- and TH2-activation.
(A) Sequential western blotting with the indicated antibodies of the nuclear (nu) and cytosolic (cyt) fractions of human primary CD4+ TH cells, TH1-skewed, TH2-skewed, or non-skewed TH0 (all three CD3/28-activated). (B) RT-qPCR quantitation of candidate TH1- or TH2-genes in WASnull T cells reconstituted with FL-WASp or its indicated mutants after CD3/28-activation under TH1- or TH2-skewing or TH0 non-skewing conditions. Normal T cell line is the control. The mRNA copy numbers derived from the control TH0 cells are not shown, but were subtracted from the displayed final mRNA values of the TH1- or TH2-skewed cells. Absolute copy numbers adjusted to GAPDH are displayed as fold change (up or down) in TH1 or TH2 cells compared to their TH0 controls. Data represent the average of duplicates from at least 5 independent experiments from 3 separate transfections, with bars indicating SEM. Wilcoxon non-parametric test using the GraphPad InStat software determined the p-values comparing the data between WASnull T cells (UT) and FL/or mutant-expressing T cells (black asterisk, p<0.01) or between FL and mutants (red asterisk, p<0.01). In data where the differences did not reach statistical significance (i.e., p>0.05), asterisk is not shown (C) Flow cytometric histogram profiles showing expression of the indicated intracellular cytokines or transcription factors for TH0-nonskewed, TH1- and TH2-skewed, CD3/28-activated T cells transfected with the indicated WASp mutants. The bar graphs next to each histogram show the shift in mean fluorescence intensity (MFI) relative to their isotype controls and was quantified using the arithmetic average on a log scale (geometric mean). (D) Quantification of the secreted cytokines in the supernatants of cell cultures, whose mRNA profile is displayed in panel C, was assessed by quantitative ELISA performed in triplicates from at least 2 independent assays. Bars indicate SEM. Asterisk denotes p<0.05.

