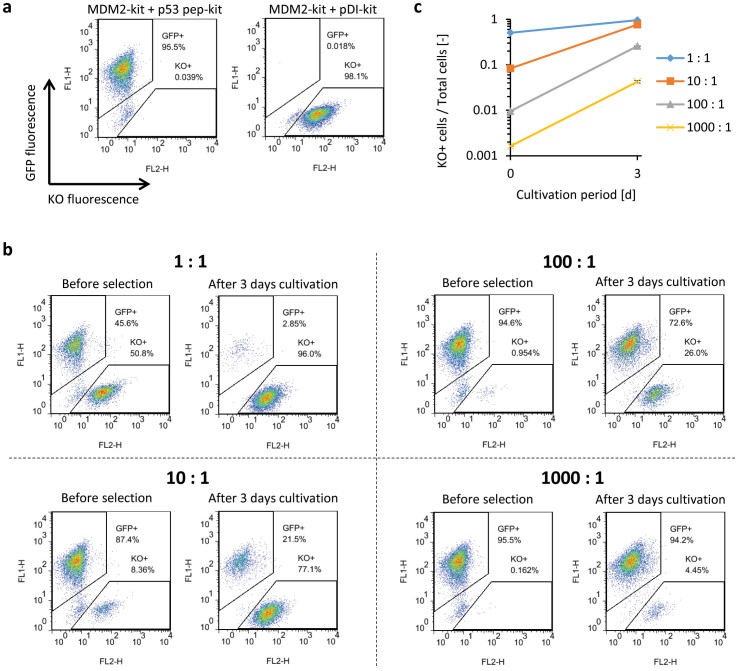
Figure 5. Enrichment of cells expressing the high-affinity peptide against MDM2.
(a) EGFP and Kusabira orange (KO) fluorescence of the cells co-expressing MDM2-kit, p53 pep-kit and EGFP, and those co-expressing MDM2-kit, pDI-kit and KO. (b, c) The EGFP-positive cells and the KO-positive cells were mixed in ratios of 1:1, 10:1, 100:1 and 1000:1. Mixed cells were cultured for 3 days, and the ratios were measured with flow cytometry. In (c), the logarithm of the KO-positive cell ratios was plotted as mean ± SD (n = 3, biological replicates).

