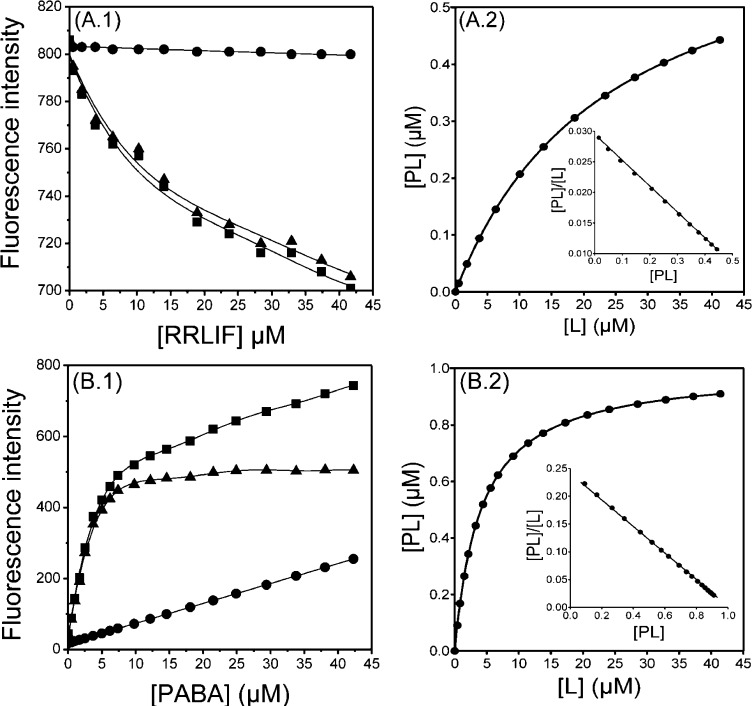
Figure 2.
Dissociation constant (Kd) determination of (A) CA2 with RRLIF at 25 °C in 50 mM Tris-HCl pH 8.0, 100 mM MgCl2; λex = 295 nm, and λem = 345 nm. Slits for excitation and emission were set at 5 and 20 nm, respectively, and (B) trypsin with PABA at 25 °C performed in 20 mM phosphate buffer (pH 7.4) containing 100 mM NaCl and 0.1% PEG6000: λex = 320 nm and λem = 370 nm. Slits for both excitation and emission were set at 10 nM. Left panels: Direct plot of fluorescence intensity against ligand total concentration. Sequential additions of ligand were made into a cuvette containing protein (CA2 or tryspin) (■) or Trp (or buffer) (●). The dissociation constant was calculated by fitting the fluorescence intensity corrected values (▲) to a quadric equation. Right panels: Saturation plot after calculation of free (L) and bound (PL) ligand concentrations. Insets: Scatchard plots.

