Figure 4.
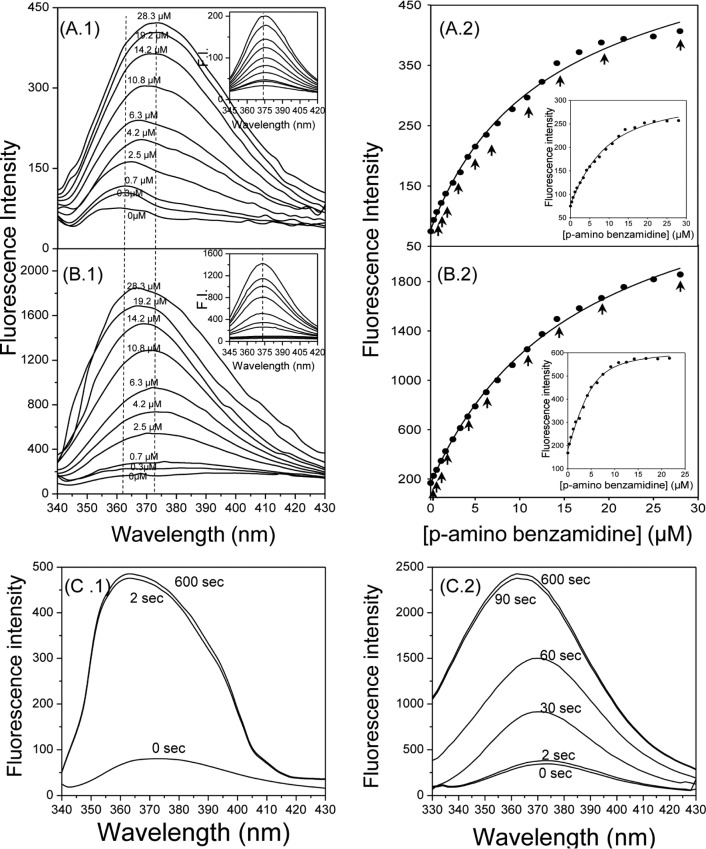
Fluorescence titration of trypsin with PABA in buffer containing 0% (A) or 50% (B) glycerol. During titration, changes of a ligand’s emission spectrum due to its binding with the protein were recorded. Experiments were performed at 37 °C in 20 mM phosphate buffer (pH 7.4) containing 100 mM NaCl, 0.1% PEG6000, and 0% or 50% glycerol (A and B, respectively). Left panels: emission spectra of PABA during its titration in trypsin (1.5 μM) solution at various conditions. Inset: emission spectra of PABA during its titration in buffer (blank experiment). Right panels: Direct plot of fluorescence raw data versus total ligand concentration during sequential additions of PABA to trypsin solution. Inset: Fitting of corrected fluorescence intensity values (after subtraction of values of blank experiments) to a quadric equation for Kd determination. Arrows indicate the points (concentrations) where the emission spectrum was recorded. (C) Monitoring of emission spectra changes at various time intervals during interaction of PABA with trypsin at 37 °C in buffer containing 0% (left) or 50% (right) glycerol. F.I.: fluorescence intensity.

