
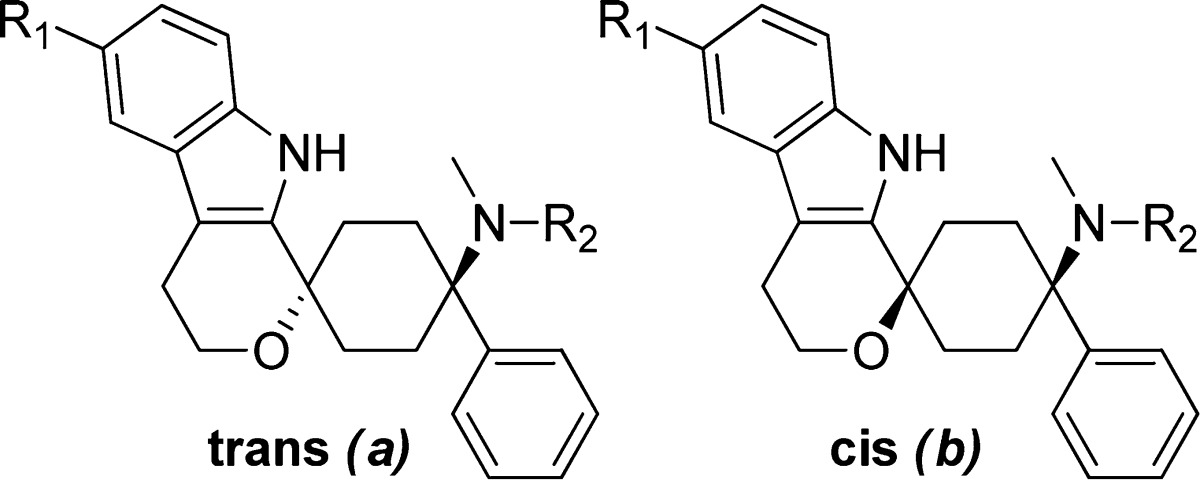
Table 3. Variation of Substituents at Major Metabolic Positions, Region B.
| % inhibition
@ 1 μM or Ki (nM) |
|||||
|---|---|---|---|---|---|
| compd | R1 | R2 | config | hNOPr | hMOPr |
| 3aa | F | Me | trans | 0.9 | 0.7 |
| 3ba | F | Me | cis | 97.4 | 46 |
| 4aa | F | H | trans | 11 | 2 |
| 47aa | Me | Me | trans | 4.5 | 2.7 |
| 48aa | OH | Me | trans | 1 | 0.4 |
| 49ab | OMe | Me | trans | 9.4 | 1.1 |
a
Hemicitrate.
b
Hydrochloride.