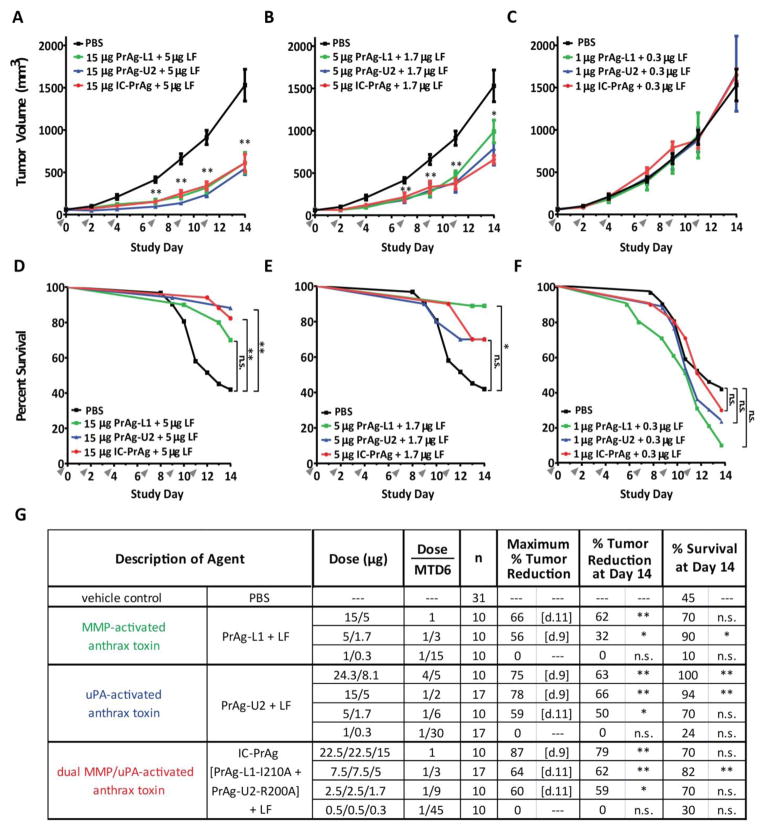
Figure 3. Engineered anthrax lethal toxins reduce B16-BL6 tumor burden and improve survival in a dose-dependent manner.
(A–C) Tumor growth and (D–F) survival of C57BL/6J mice bearing B16-BL6 melanoma syngrafts that were treated with six I.P. doses of either PBS (black lines) or engineered anthrax lethal toxins, MMP-activated PrAg-L1 + LF (green), uPA-activated PrAg-U2 + LF (blue) or dual MMP/uPA-activated IC-PrAg + LF (red), at time points indicated by grey arrowheads. All cohorts were treated in parallel and the PBS control groups depicted in panels A–C and D–F are the same. Note that the anti-tumor effect was independent of the proteolytic-activation site; PrAg-L1 + LF, PrAg-U2 + LF and IC-PrAg + LF exhibited indistinguishable anti-tumor effects when administered at protein equivalent doses (A–C). Tumor volume data are expressed as mean tumor weight ± standard error of the mean; *, P<0.05, **, P<0.01, Student’s two-tailed t-test. (D–F) Kaplan-Meier survival curves were compared via Log-Rank test; *, P<0.05, **, P<0.01. (G) Table summarizing anti-tumor and survival effects associated with engineered toxin administration. Abbreviations: n = mouse number, [d.X] = trial day on which maximum % tumor reduction was observed. P-value for % tumor reduction on day 14 was calculated in comparison to the control PBS-treated tumor cohort using a two-tailed Student’s t-test; *, P<0.05, **, P<0.01. P-value for % survival was calculated by comparing Kaplan-Meier survival curves of experimental cohorts with that of the PBS-treated cohort using the Log-Rank test, two-tailed;*, P<0.05, **, P<0.01.

