
Fig. 3.
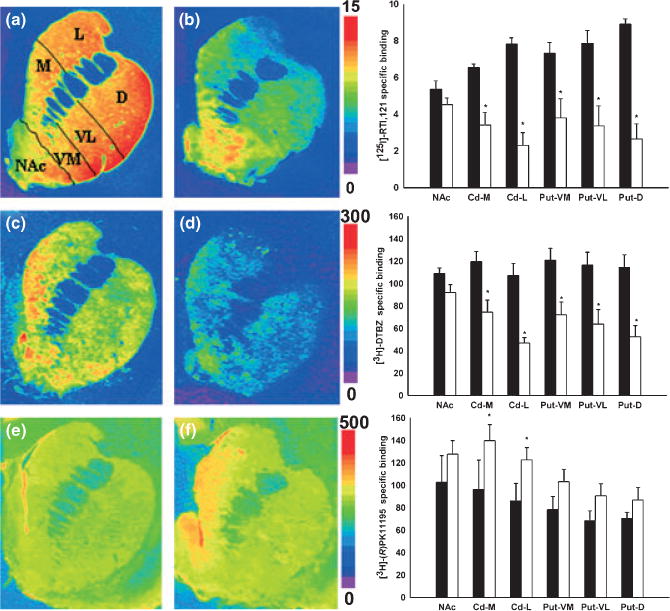
Representative brain autoradiograms (coronal plane) of [125I]-RTI 121 binding to DAT (a and b), [3H]-DTBZ binding to VMAT2 (c and d) and [3H]-(R)-PK11195 binding to TSPO (e and f) at the level of the caudate and putamen in control (a, c and e) and MPTP-treated baboons (b, d, and f). Pseudo-color bar on the right side of each image set represents the level of receptor binding (fmol/mg tissue). Specific binding of DAT, VMAT2, and TSPO measured in subregions of the caudate, putamen and nucleus accumbens in control (black bar, n = 3) and MPTP animals (white bar, n = 5) (corresponding graph next to each image). Each value represents the mean ± SEM. (*p < 0.05). NAc = nucleus accumbens, Cd-M = caudate-medial, Cd-L = caudate-lateral, Put-VM = putamen-ventromedial, put-VL = ventrolat-eral, D = putamen-dorsal.