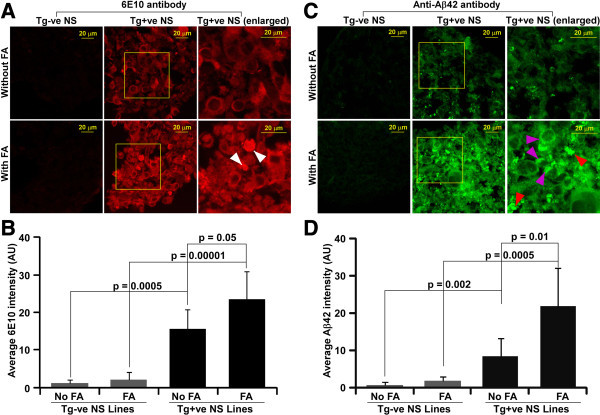
Figure 11.

Detection of Aβ peptides within neurospheres by CDIC. (A) Neurosphere sections (10 μm thick) were either treated with FA or left untreated, then immunostained with 6E10 antibody. Confocal images were captured using similar exposure settings and displayed with similar intensity scale. White arrowheads indicate the presence of puncta within neurosphere sections. (B) Fluorescence intensities were measured and are plotted as histograms of mean + SD of six neurospheres sections. (C) Neurosphere sections were also immunostained with an anti-Aβ42 antibody with similar pretreatments. Red and purple arrowheads indicate the presence of puncta outside and within the cells respectively. (D) Intensity of Aβ42 fluorescence was measured from six independent neurosphere sections and the mean + SD is plotted as histograms. Student’s T-test was performed. p value ≤ 0.05 indicate significant difference between the groups.
