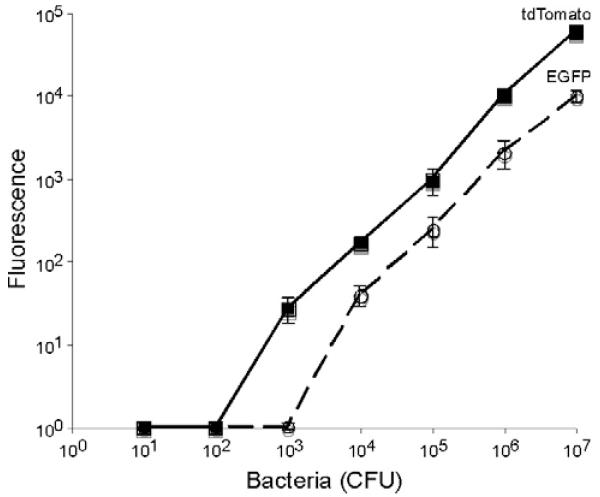
Fig. 3.
Threshold of detection for tuberculosis expressing EGFP and tdTomato fluorescence proteins and correlation with colony-forming units (CFU). Data shown are the means and standard deviations of a representative experiment done in triplicate. Data points below background were corrected to one so that they could be plotted on a log scale.

