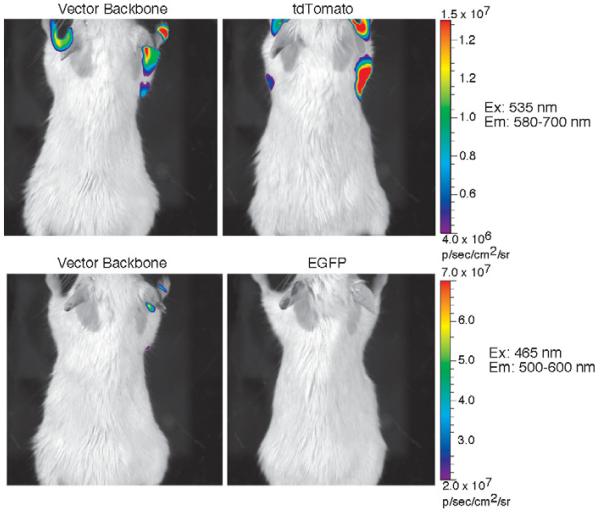
Fig. 4.
Fluorescence emission in photons/second/square cm/surface area (p/s/cm2/sr) of mice infected intranasally to deliver approximately 105 mycobacteria into the lungs. Bacteria carry either the vector backbone, vector expressing EGFP (EGFP) or vector expressing tdTomato (tdTomato). The color bar to the right of images applies to both images in a row and displays the colorized intensity of fluorescence emission from each animal under the excitation (Ex) conditions shown to the right of each row of images by transillumination with spectral unmixing over the wavelength range shown for emission (Em). Imaging was carried out using the IVIS Spectrum (Caliper/Xenogen) and LivingImage Software provided by the manufacturer. All images were captured under the same conditions and analyzed in an identical fashion, except that the final fluorescence scales for tdTomato and EGFP were set differently due to their different optical properties.

