Figure 6.

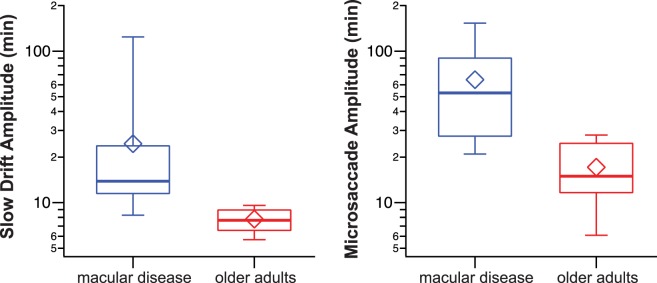
Box-and-whisker plots comparing the amplitudes of slow drifts (left) and microsaccades (right) between the two groups of observers. Details of the box and whiskers are as in Figure 2.

Box-and-whisker plots comparing the amplitudes of slow drifts (left) and microsaccades (right) between the two groups of observers. Details of the box and whiskers are as in Figure 2.