. 2014 Jul-Aug;48(4):354–359. doi: 10.4103/0019-5413.136216
Copyright: © Indian Journal of Orthopaedics
This is an open-access article distributed under the terms of the Creative Commons Attribution-Noncommercial-Share Alike 3.0 Unported, which permits unrestricted use, distribution, and reproduction in any medium, provided the original work is properly cited.
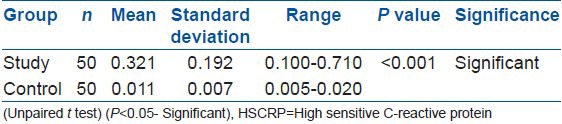
Table 2.
Comparison of HSCRP levels between two groups