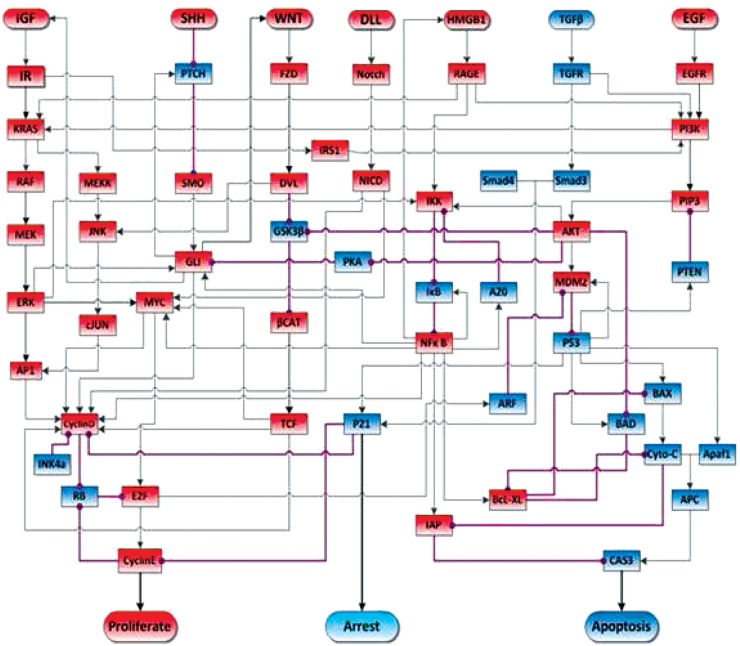
Figure 1.
Schematic view of signal transduction in the pancreatic cancer model. Blue nodes represent tumor-suppressor proteins, red nodes represent oncoproteins/lipids. Arrow represents protein activation, circle-headed arrow represents deactivation. The acronyms in each rectangular node stand for signal transduction proteins. The rounded rectangular nodes on the top of the figure stand for ligands that activate the pathways. Finally, the rounded nodes at the bottom stand for a cell behavior activated by the connected effector proteins. Figure adapted from Gong et al. (2011c).

