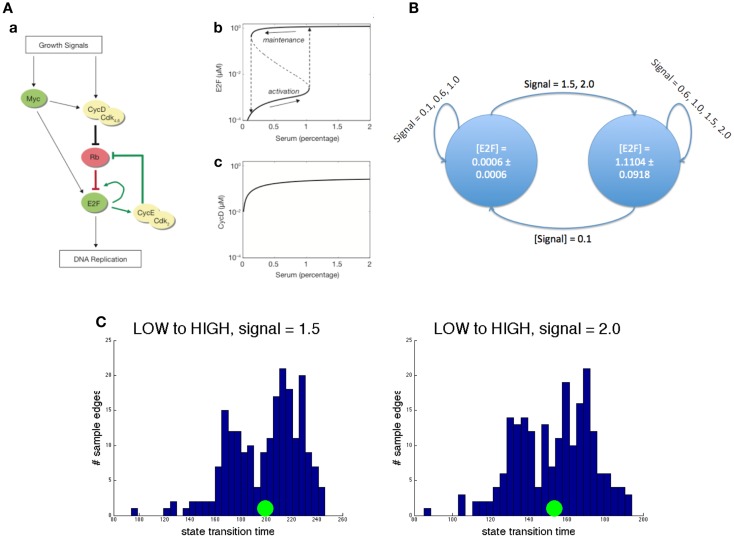
Figure 3.
Abstraction example. (A) A concrete ODE model. Left: circuit diagram. Pointed arrows denote activation while flat head arrows denote inhibition. Right: demonstration of hysteresis in E2F concentration and the lack of it in cyclin D concentration. (B) Its reduced abstraction model. Each state is actually characterized by statistics on all species in the original model. Here, the mean and SD of E2F is used for brevity. Each edge is marked by the growth signal values (mean and SD) that cause that transition. (C) Two representative edge distributions. The left panel shows the distribution of transition time from the low E2F state to the high one when the growth signal value is 1.5. The right panel shows the same transition for a growth signal value of 2.0. In both, the green circle represents the mean. Notice that the distributions look similar but the mean transition time decreases substantially for the higher input.

