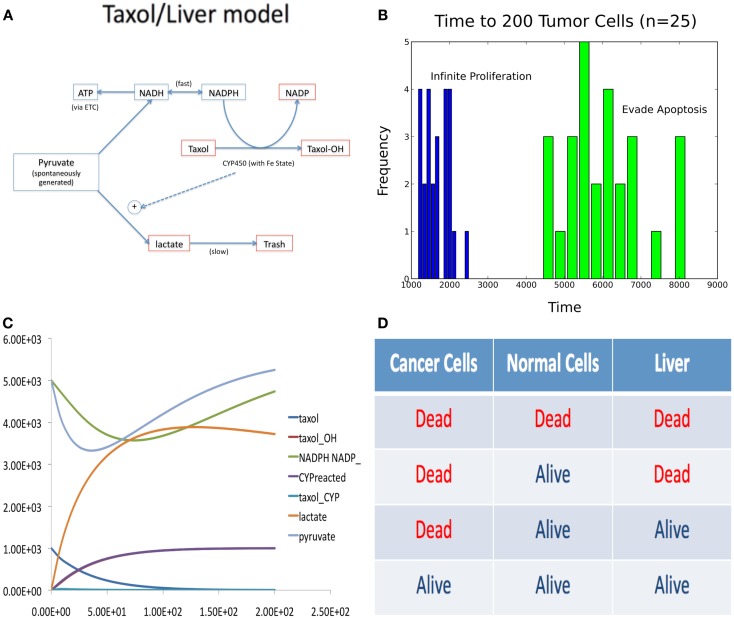
Figure 4.
Figures accompanying the composition model. (A) Wiring diagram of liver model. (B) Time to tumor for different phenotypic aberrations. (C) Sample trace of ODE liver model simulation. (D) Four possible steady-state outcomes of composite model simulation, with different Taxol delivery schedules.

