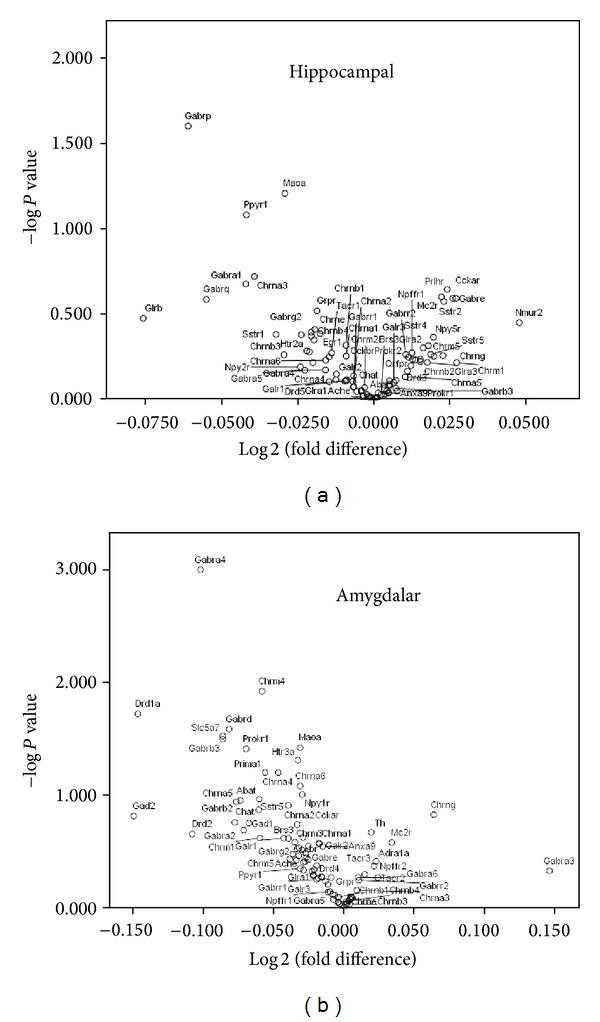
Figure 2.

Differential expression of (a) hippocampal and (b) amygdalar mRNA between groups. Volcano plot between Log 2 fold change on the x-axis (for neurotransmitter receptors and regulators in L-theanine/midazolam treated groups 40 PTSD-stressed versus 40 nonstressed (control) groups) and −log of P value on the y-axis. Eighty male Sprague-Dawley rats were injected subcutaneously 30 minutes prior to evaluation of their performance on neurobehavioral tests. The rats were then euthanized and cDNA prepared from the hippocampus (a) and amygdala (b) and were subjected to RT2 profiler PCR array for rat neurotransmitter receptor and regulator analysis, as described in Materials and Methods. PCR array profiles were performed for the expression of 88 genes potentially involved in PTSD and/or rat neurotransmitter receptors and neurotransmitter regulation.
