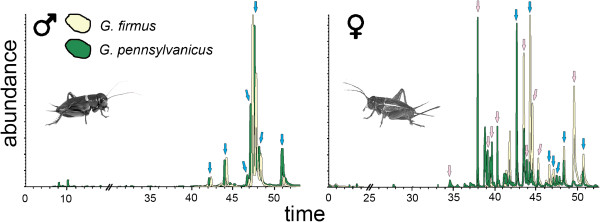
Figure 3.

Overlaid chromatograms of the two species.G. firmus CHC profile is shown in yellow and G. pennsylvanicus is shown in green. Males (left) and females (right). The X-axis is the retention time in minutes and the Y-axis is the relative CHC peak abundance. Arrows represent the scored peaks, typical male peaks (blue, n = 7) and female peaks (pink, n = 10), all peaks (when present) were measured in all individuals. Individuals used in this figure are shown in Additional file 1: Figure S1.
