Figure 3.

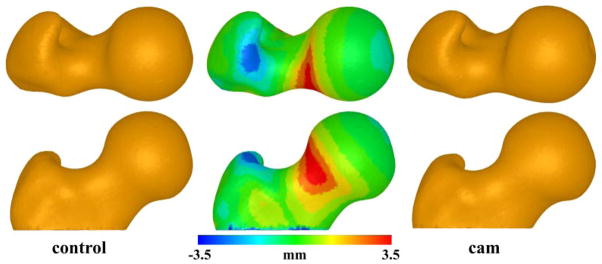
Mean control (left) and cam (right) shapes. Middle images demonstrate how the mean cam shape differed relative to the mean control shape (shown). Top and bottom rows show different rotations of the femoral head.

Mean control (left) and cam (right) shapes. Middle images demonstrate how the mean cam shape differed relative to the mean control shape (shown). Top and bottom rows show different rotations of the femoral head.