
Figure 6.
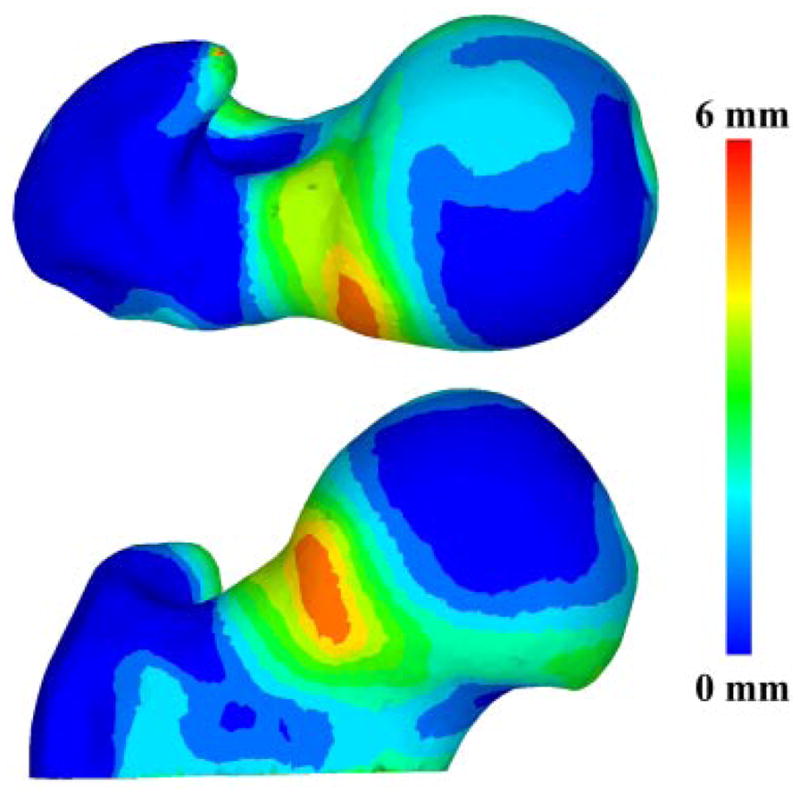
Color plot of a single cam FAI femur (shown) and the amount it deviated from the average control femur. These plots could be used as guide for planning surgical debridement to relieve FAI.
Official websites use .gov
A
.gov website belongs to an official
government organization in the United States.
Secure .gov websites use HTTPS
A lock (
) or https:// means you've safely
connected to the .gov website. Share sensitive
information only on official, secure websites.
Color plot of a single cam FAI femur (shown) and the amount it deviated from the average control femur. These plots could be used as guide for planning surgical debridement to relieve FAI.