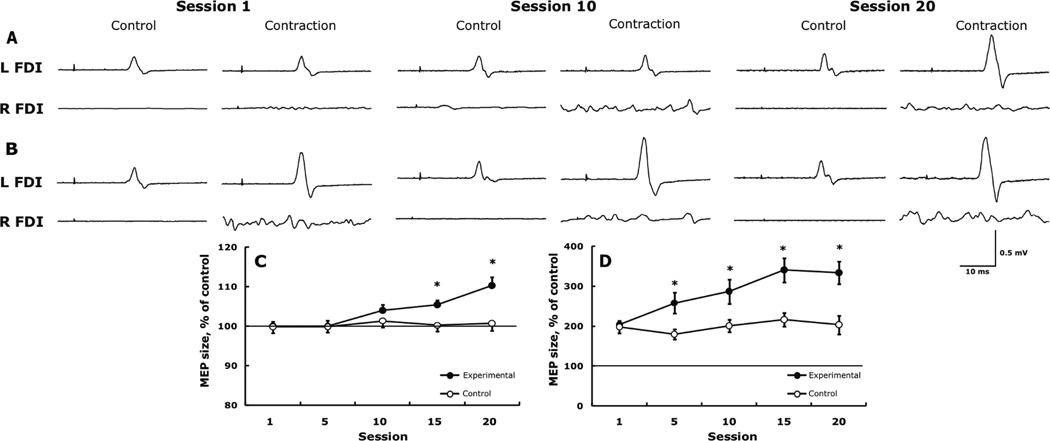
Figure 4.
Representative example in one subject for changes in the facilitation of motor evoked potentials (MEPs) produced by TMS and muscle contraction. MEPs produced by TMS 20% above resting motor threshold (rMT) in the left FDI at rest (control) and combined with contraction of the right FDI at 20% MVC (A) and by TMS 160% above rMT and 80% MVC (B). Note the facilitation of MEPs in panel B compared with panel A at rest and due to the stronger contraction and TMS. Note also how the facilitation of ipsilateral MEPs becomes increasingly larger across sessions. Each tracing is the average of 7 trials. L and R FDI, left and right first dorsal interosseus. Group data for the weak TMS combined with weak contraction (C) and for strong TMS combined with strong contraction (D) in the experimental, trained (filled symbols) and control, untrained group (open symbols). In panels C and D, data are expressed as a percent of the control MEP. * p < 0.05 between the two groups and relative to session 1.

