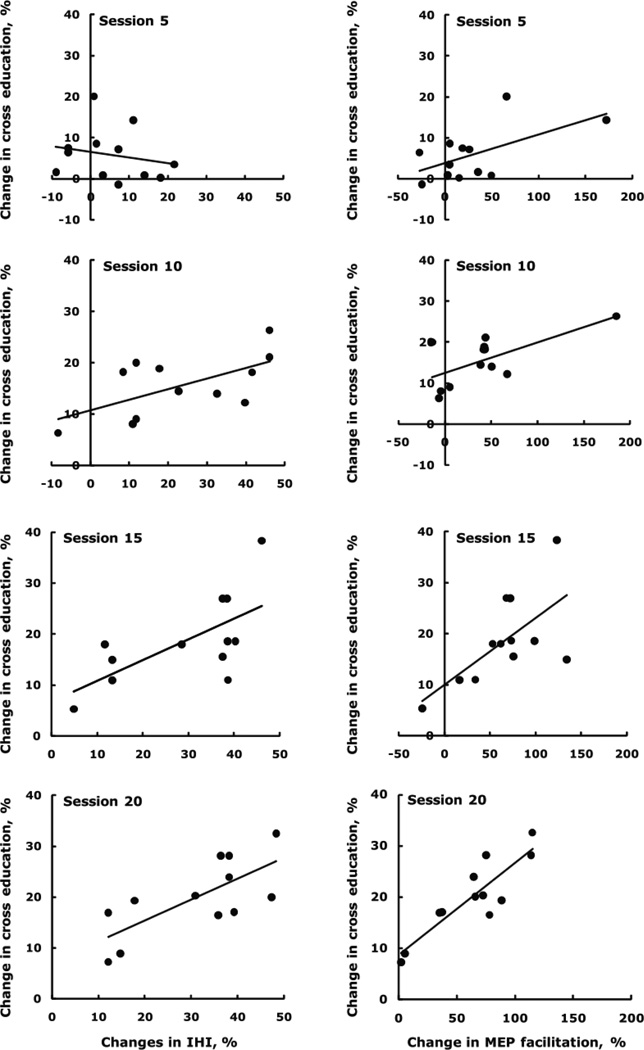
Figure 5.
Time course of correlations between changes in cross education and changes in interhemispheric inhibition at rest (left column), showing the evolution and consolidation of interhemispheric plasticity in relation to cross education. The relationships became stronger across session 5: R2 = 0.04, y = −0.14x + 6.5; session 10: R2 = 0.37, y = 0.21x + 10.7; session 15: R2 = 0.43, y = 0.41x + 6.8; session 20: R2 = 0.52, y = 0.41x + 7.3. Time course of correlations between changes in cross education and changes in the facilitation of motor evoked potentials in the left, untrained FDI by TMS of the right primary motor cortex at an intensity 160% above resting motor threshold combined with concurrent contraction of the right FDI at 80% MVC (right column). The relationships became stronger across session 5: R2 = 0.34, y = 0.07x + 3.8; session 10: R2 = 0.43, y = 0.07x + 12.5; session 15: R2 = 0.43, y = 0.13x + 10.0, and session 20: R2 = 0.78, y = 0.18x + 8.6.

