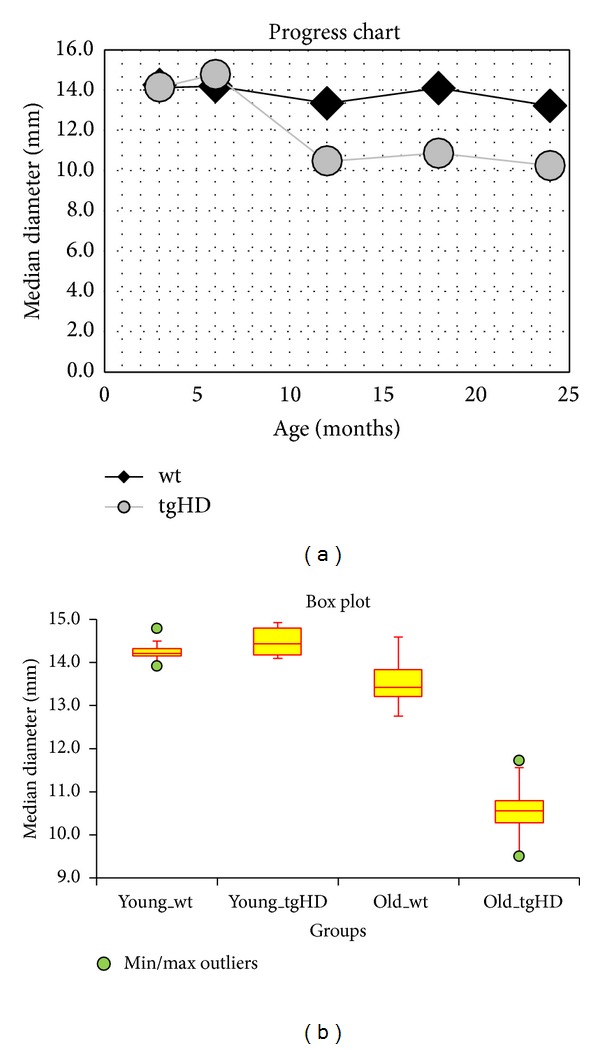
Figure 5.

(a) Progress Chart: the progression in decrease of the median diameter of neuronal nuclei with age of rats in wt groups (black line) and tgHD51 rats (grey line). (b) Box Plot: statistical characteristic of the groups of rats. The multiple comparison of the median diameter of neuronal nuclei of the groups of rats: “young_wt” and “young_tgHD” are groups of rats 3 and 6 months (0–6 months) old; “old_wt” and “old_tgHD” are groups of rats 12, 18, and 24 months old (>6 months).
