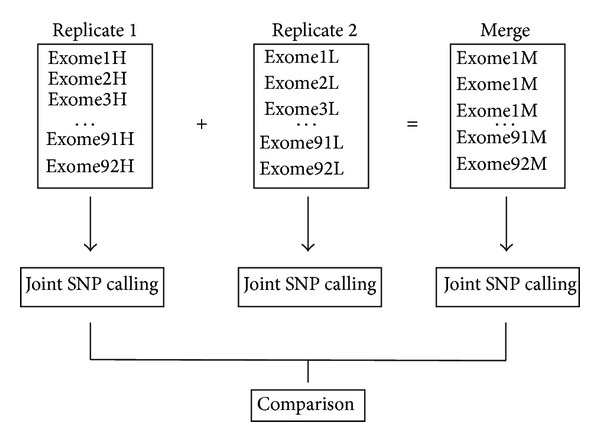
Figure 1.

Schematic of SNP calling strategies in this study. For 92 subjects with duplicates, we divided them into two groups (replicate 1 and replicate 2) according to mean sequencing depth across the target regions. The replicate 1 group is comprised of exomes with the relative high mean depth (marked with Exome1H to Exome92H). The remainders with the relative low depth are grouped as replicate 2. Merging BAM files from the two duplicates generates a third group, referred to as the merged group flagged with Exome1M to Exome92M.
