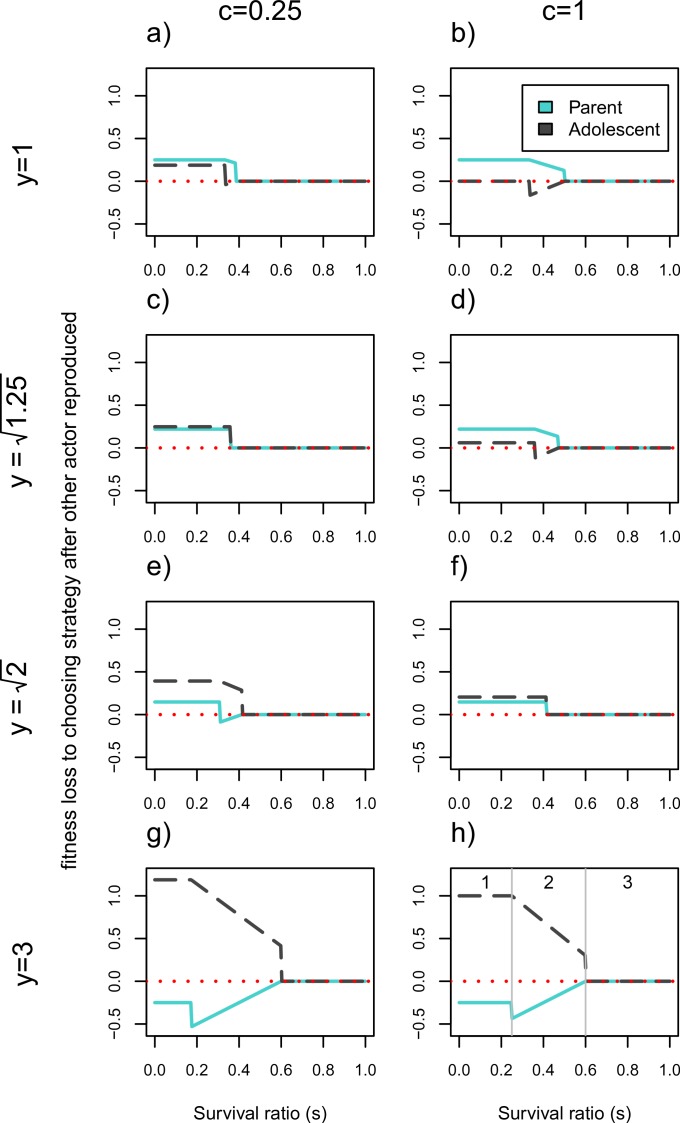
Figure 2. Cost of choosing strategy after the other actor has reproduced.
Fitness losses are plotted as a function of the survival ratio, s, of 2 vs. 1 infant in the household. The solid line denotes the older generation (i.e., the parent), and the dotted line denotes the younger generation (i.e., the adolescent). The larger the fitness losses from not reproducing first, the more likely the actor is to win the conflict. Values of c = 0.25 and c = 1 represent low and high parental continuity respectively, and increasing values of y represent higher fitness of the younger generation’s infant. When y = 1 there is no senescence. Intermediate y values correspond to values of for c = 0.25 and c = 1 respectively. At these values the payoffs work out such that the actors never disagree about whether there should be two or one infant in the household. Plot (H) shows the limits of three functionally different zones; zone (1) where only one actor will reproduce, (2) where the number of infants produced will depend on who reproduces first, and (3) where both actors will reproduce. The corresponding zones can be found in all other plots except for (C) and (F) where zone 2 disappears.

